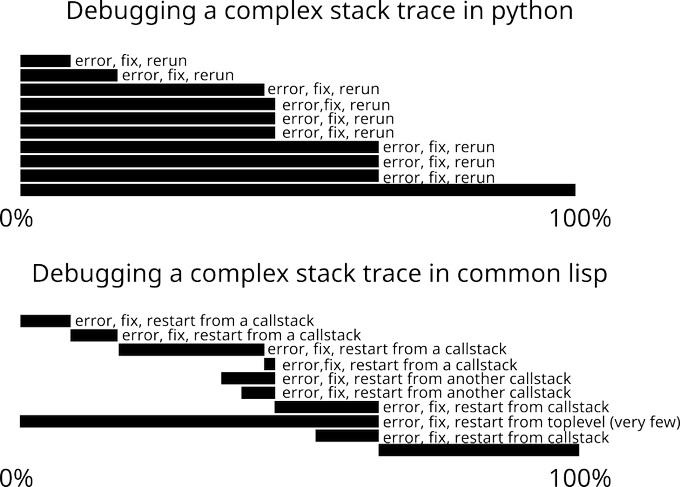
You are doing god’s work on a time-intensive computation, but your final step errors out :S Are you doomed to start everything from zero, and wait again for this long process? No! Find out.
I show this with Emacs and Slime, then with the Lem editor (ready-to-use for CL, works with many more languages thanks to its LSP client).
(This video is so cool :D Sound on)
We use the built-in Common Lisp interactive debugger that lets us restart one precise frame from the call stack. Once you get the debugger:
- press “v” on a frame to go to the corresponding source file
- fix the buggy function, compile it again (C-c C-c in Slime)
- come back to the debugger, place the point on the frame you want to try again, press “r” (sldb-restart-frame, see your editor’s menu)
- see everything succeed. You did not restart everything from zero.
- if you don’t see some function calls and variables in the debugger, compile your code with max debug settings (
C-u C-c C-cin Slime).
For more:
- https://lispcookbook.github.io/cl-cookbook/debugging.html - see how to break and step, how to trace function calls, etc.
Other videos:
- How to create a full-featured Common Lisp project with my project generator.
- How to call a REST API in Common Lisp - example with the GitHub API, sending HTTP requests, parsing JSON, building a binary.
Hope you learned something!
